
ⓘ
Independent testing and analysis: The data and testing presented below were conducted independently of KipperTie. The resulting measurements have subsequently been processed and analysed using AI-assisted algorithms.
LCcineND colour performance
LCcineND is designed to remain colour-stable across its full operating range. The measurements below are taken across 10 serial numbers of 4 × 5.65″ LCcineND glass and show extremely small changes in chromaticity as density changes. The result is a neutral, consistent image from the densest setting through to maximum transmission.
Colour consistency across the full ND range
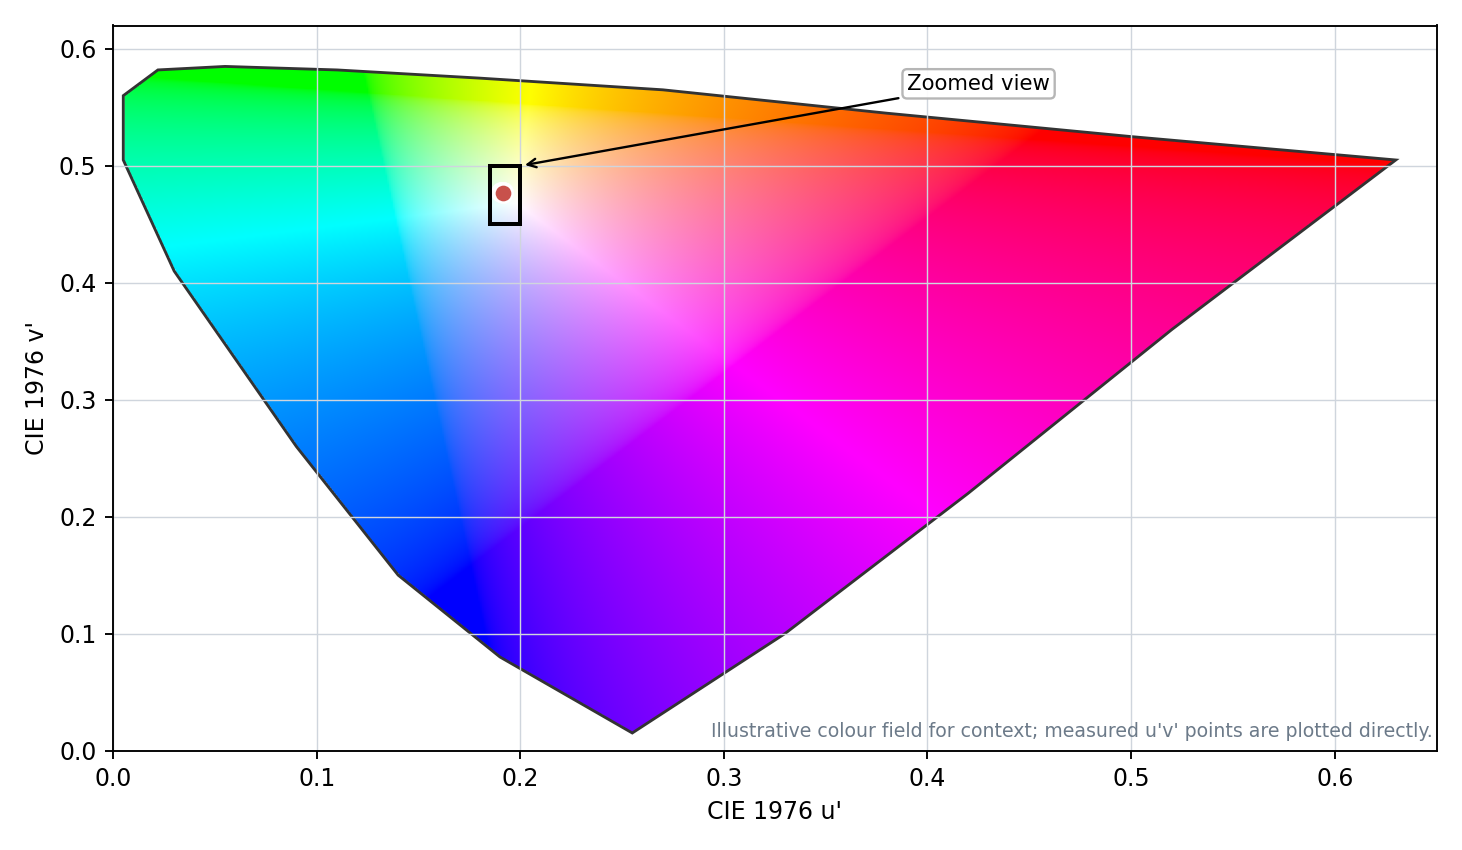
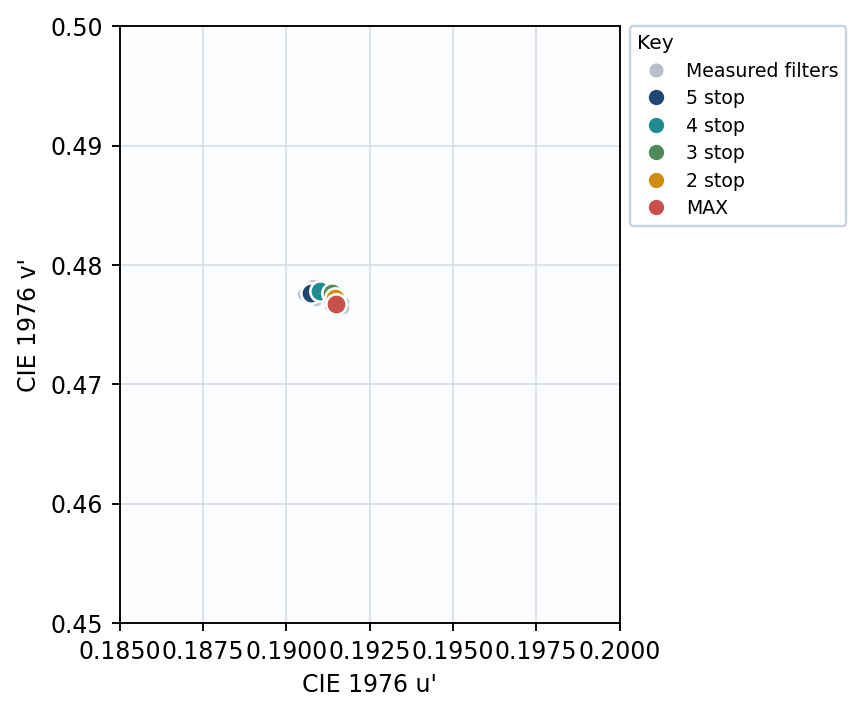
Across the complete measured range, the average chromaticity path moves by only Δu’v’ 0.0012. The first graph shows that movement in the context of the complete CIE 1976 u’v’ colour space. The rectangle identifies the area enlarged in the second graph, making the very small separation between operating points easier to see.
Measured attenuation
The mean measured operating points are 5.0, 4.0, 3.0, 2.0 and 1.5 stops. These measurements are taken before KipperTie calibration. During production, firmware calibration compensates for the small unit-to-unit variation visible in the raw measurements, giving each calibrated LCcineND a consistent relationship between commanded density and optical transmission.
Spectral response
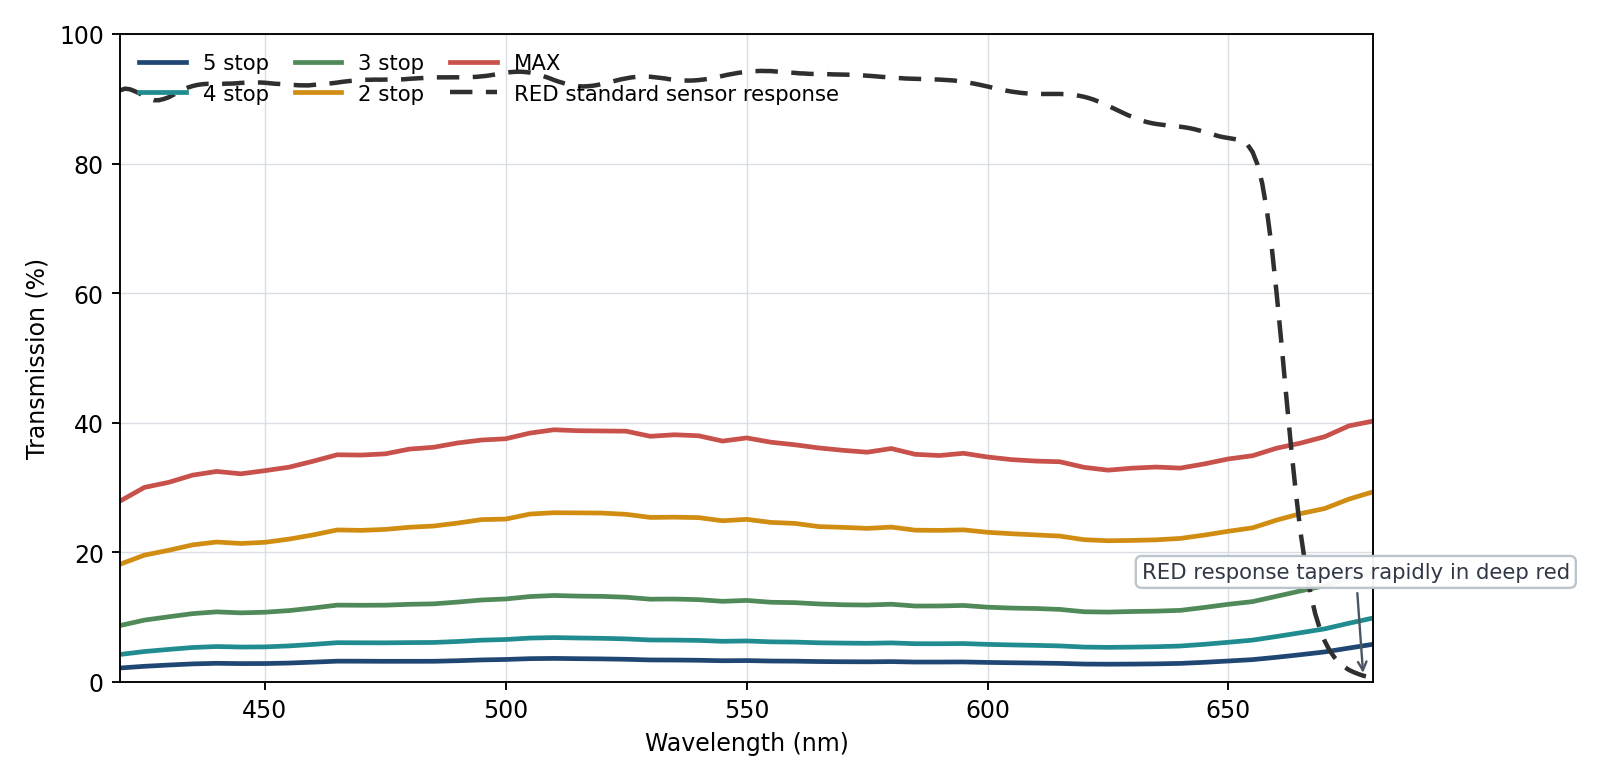
The graph below shows LCcineND transmission across the camera-sensitive visible frequencies, with the RED standard sensor response overlaid for context. Each density setting maintains a smooth spectral shape through the part of the spectrum that contributes most strongly to the recorded image.
Colour accuracy and IR behaviour
The closely-grouped chromaticity measurements and smooth spectral curves indicate very good colour neutrality across the working ND range. There is no pronounced change in spectral shape as density is adjusted, reducing the likelihood of density-dependent colour casts. In the deep-red region the RED sensor response falls rapidly, while the LCcineND curves remain smooth rather than showing a sudden red-biased rise. Taken together, these measurements indicate a low likelihood of significant IR-driven colour contamination within the camera-sensitive range represented here.
As with any optical system, the final recorded colour is also influenced by the camera sensor, OLPF, lens, lighting spectrum and any additional filtration in the optical path.
Predictable electronic control
LCcineND also maintains a smooth electrical-to-optical response. Transmission at 550 nm changes progressively with drive voltage, allowing density to be controlled continuously rather than as a series of fixed filter steps.
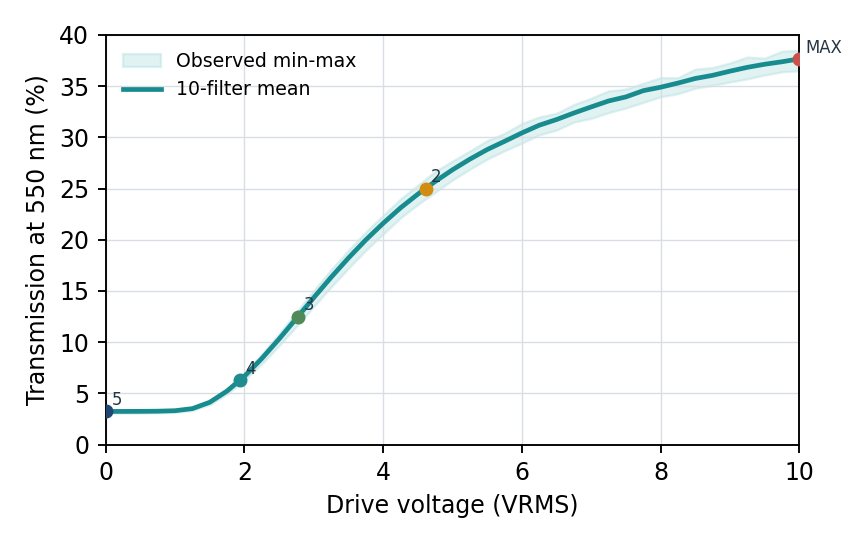
Data shown represents measurements from 10 LCcineND 4 × 5.65″ filters. Transmission values are pre-KipperTie calibration measurements; production firmware calibration compensates for minor unit-to-unit variance.